Genetics of Obesity

Genetics of Obesity

Weight Watchers: How much you weigh depends on many metabolic pathways, brain signals that regulate appetite, and environmental factors such as your lifestyle and diet. At least some of this is coded by genes, but narrowing down which ones is like finding the proverbial needles in a haystack. There are millions of gene variants, known as single-nucleotide polymorphisms or SNPs (pronounced snips), between any two people, than can be read from a sample of DNA (from a cheek swab). A Genome Wide Association Study or GWAS (pronounced Gee-Wahs) compares gene variants between two groups of people, say skinny and overweight, to see if any particular variant is associated with a trait, like obesity.  If any particular SNP is significantly more frequent in obese people, compared to the skinny group, then that SNP could mark a gene associated with body weight.

The Manhattan Plot: Named for a city skyline rather than a Hollywood thriller, this scatter plot helps pinpoint the genetic variants associated with obesity. Each color represents a different chromosome, with the largest chromosome on the left, going down in size and ending with the X chromosome on the far right. Each colored dot is a SNP, and the higher it is on the vertical (y axis) the bigger the difference of that variant between the two groups. In this study, the most significant SNPs were on chromosome 16 (light gray dots), in a gene called FTO. In another study, researchers measured levels of the hunger hormone grehlin after a meal: in people with a high risk variant of the FTO gene, grehlin levels in the blood stayed high, instead of dropping to signal that they were full. FTO codes for an enzyme that alters chemical modification (methylation) on the RNA messages coding for many proteins. For more on FTO see the Wiki page (http://en.wikipedia.org/wiki/FTO_gene). 

The Thrifty Gene Hypothesis: In 1962, geneticist James Neel proposed that gene variants contributing to obesity may have been of selective advantage during ancient times of food scarcity. For example, mice with mutations in the Mrap2 gene gain more weight for the same number of calories consumed. Not to be outdone, biologist John Speakman countered with the Drifty Gene Hypothesis which suggests that the loss of threat from predators, about 2 million years ago, removed a key factor selecting against obesity! The biological battle of the bulge continues….

REF: A Genome-Wide Association Study on Obesity and Obesity-Related Traits.  Kai Wang et al., PLoS ONE http://goo.gl/2QGOFR

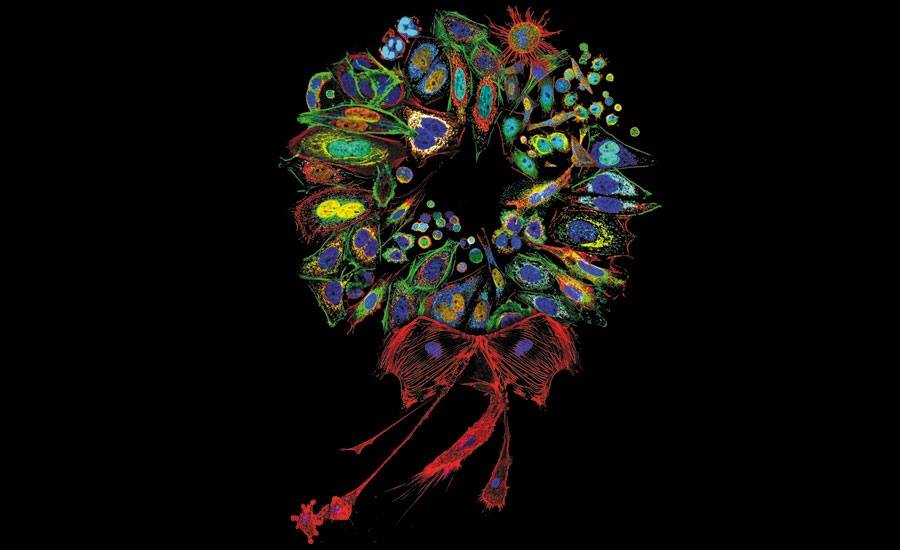
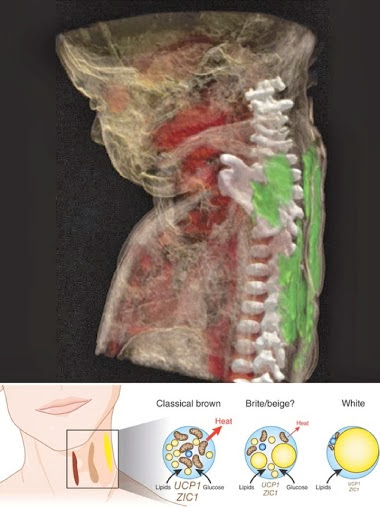
Image: From +BPoD http://bpod.mrc.ac.uk/archive/2014/1/14

#ScienceEveryday  

Posted in Rajini Rao | Tagged | 58 Comments

Science Mystery Pix

Science Mystery Pix

Art or Nature?: This beautiful image reminds me of the art of Van Gogh: Willows at Sunset (http://goo.gl/E0rYPo), perhaps? But it’s actually a photomicrograph of an insect part. Can you guess what it may be? Hint: it’s useful during aquatic sex 🙂 

Rheinberg Illumination: This image was colorized using a form of microscopy invented in 1896 by Julius Rheinberg. Quite simply, a two colored filter, usually cut from sheets of acetate, is placed in front of the light source. One color makes up the background while the other is diffracted by the object under study. It’s a cheap and creative way to bring art into science! A nice explanation can be found here: http://www.cellsalive.com/enhance1.htm

Photo credit: Spike Walker / Wellcome Images

#ScienceEveryday    #ISeeTheWorldWithScience  

Posted in Rajini Rao | Tagged , | 85 Comments

The Biology of Transparency

The Biology of Transparency

The Invisible Man: Have you ever wished to be invisible? Transparency is quite common in biology, being particularly useful as camouflage in the open ocean where there is nothing to hide behind. There is an astonishing variety of transparent jellyfish, glass squid, worms and this creepy-crawly crustacean from the “twilight zone” of the deep sea seen in the image. 

How does it work? To be transparent, light must pass through without being absorbed or scattered. Most organic molecules do not absorb light in the visible range, except for the visual pigments of the eyes, which must absorb light to function. Light scattering is caused by changes in refractive index which determines how light is bent as it passes through (see http://goo.gl/7l6zFC). To be perfectly transparent, the refractive index should be the same throughout. This is clearly a challenge in biological tissues, where lipid membranes and protein/DNA rich organelles (like mitochondria or nuclei) are much denser than the surrounding cytoplasm. So transparent animals resort to a number of tricks to avoid light scattering.

See Right Through Me: One way is to become extremely flat! Since there is an exponential relationship between thickness and light absorption/scattering, a 1 cm thick tissue that is 60% transparent will achieve 95% transparency if it is only 1 mm thick. Some tissues, like the lens of our eyes, undergo drastic reduction of complexity, relying on neighboring cells to feed them. At the ultrastructural level, surfaces can be cloaked in submicroscopic bumps, smaller than half the wavelength of light that average out the differences in refractive indexes. Known as moth eye surfaces, these are responsible for the transparency of the beautiful glasswing butterfly Greta oto (see http://goo.gl/KS85mo).

I See You!: It’s hard to keep the gut transparent, unless one only eats transparent food, like the larvae of the phantom midge that sucks out clear fluids from its prey. Also, transparency can be foiled by predators that have evolved to use UV light or even polarized light to spot their prey, since underwater light is polarized particularly in the horizontal plane. A study with squid showed that they attacked plastic beads with birefringence, preferentially over beads without this optical property. Something to think about before you invest in an invisibility cloak!

GIF: This 9 cm long amphipod is nearly completely transparent. Via http://goo.gl/bL14Oy from the video below.

Video: For a short 2:41 minute video of more stunning transparent creatures, watch Deep Sea Creatures – Nature’s Microworlds – Episode 11 Preview – BBC Four

REFhttp://biology.duke.edu/johnsenlab/pdfs/pubs/transparencyreview.pdf

Musical InspirationQueen – ‘The Invisible Man’

#ScienceSunday   #ScienceEveryday  

Posted in Rajini Rao | Tagged , | 109 Comments

Science Santa and a Cellular Christmas

Cellular Xmas wreath created by Donna Stolz from images of mammalian cells. The picture won recognition for the University of Pittsburgh biologist in the 2011 Nikon Small World photography contest.
source: https://www.nature.com/news/365-days-images-of-the-year-1.9620

Twas the night before Christmas, when all through the lab

Not a creature was stirring, not even a postgrad.

The pipetmen and tip boxes were arranged with care,

In hopes that science elves soon would be there.

The postdocs were nestled all snug in their beds,

While visions of job offers danced in their heads.

And the PI, at home, took off her many caps

And rested her brains for a well-deserved nap. 

When from the cell culture room there arose such a clatter

The grad student rushed to see what was the matter? 

Away to the culture hood he flew in a flash

Turned off the UV light and raised up the sash.

The neurospheres bobbed merrily in their own private party

Transiently transfected, they proliferated smartly.

The epithelial cells broke free from their tight junctions 

Downregulating e-cadherin and migrating to the function.

The mycoplasma were raising microscopic mayhem

And the opportunistic fungus could barely be stemmed.

But hush! There came silence and the ruckus stalled

For here is Science Santa with presents for all!

Data for the PhD candidate in her fifth year

The replicates have p values <0.005, never fear!

Acceptance without revision from the journal Nature?

The young post-baccalaureate just advanced in stature.  

A tenure-track position, which was his sole goal

Now the senior postdoc won’t be on the dole.

For the PI, her broken budget can finally be mended 

That R01 in the 5th percentile will surely be funded?!

With a wink of an eye and a twitch of his nose

His bounty unloaded, up and away he rose.

Then Science Santa called, as he flew into the New Year

Happy Experimenting to all, and to all Good Cheer!

CELLULAR CHRISTMAS

Donna Stolz (Univ. Pittsburgh) created this festive wreath by assembling images of mammalian cells from more than 25 experiments. 

Apologies to Clement Clarke Moore who wrote the original (and better) poem in 1822: http://www.carols.org.uk/twas_the_night_before_christmas.htm

Suggestions, additions or edits to the bad rhyme? 🙂

#MerryChristmas   #ScienceEveryday  

Posted in Rajini Rao | Tagged , | 88 Comments

The Science of Snow!

The Science of Snow!

Stellar dendrites are falling. Rimed crystals are piling on so heavily, they you may see graupel. If you’re lucky you may spot a split star or a rare capped column. No, I’m not talking gibberish! You can check the “Meteorological Classification of Natural Snow Crystals,” (1966) by Magano and Lee.  Did you know that there are 80 official patterns of snowflakes? Their characteristic 6-sided shape comes from the hexagonal lattice of water molecules: each vertex has an oxygen atom with the edges formed by hydrogen bonds on either side (see http://goo.gl/8ZUI0G). 

Is it true that no two snowflakes are alike? The short answer is yes! At the atomic level, suppose one snow crystal has 10^18 water molecules, of which 10^15 will contain deuterium isotope (hydrogen with mass of 2 instead of 1) or an isotope of oxygen (mass of 18 instead of the more common 16). Imagine the different ways these could be arrange in the crystal. Then consider the hundreds of different morphological features of snowflakes and the ways they may be arranged. If 100 books could be arranged on a shelf in 10^158 ways (1 followed by 158 zeroes, which is more than all the estimated atoms in the universe), the probability that two identical snowflakes exist is infinitesimally small.  

How to view a snowflake at >1,000 times magnification? What you see will surprise you. They don’t look quite that regular or perfect. Their art form is more steam punk than a Hallmark holiday card. You may even see the face of Optimus Prime or an alien starship.  

1) Capture freshly fallen snow from around the country. It’s more naturally diverse than the man-made stuff that is smooth and gob-like.

2) Brush the flakes on to a pre-chilled copper plate coated with a gel of methyl cellulose.

3) Chill right away in liquid nitrogen, down to -196 C.

4) Mount on a scanning electron microscope with a viewing stage chilled to -176 C.

5) Justify your work: “‘Information gained from studying the structure of snow is vital to several areas of science as well as to activities that affect our daily lives…”  from USDA.gov 🙂

Happy Holidays! 

REF: For all you wanted to know about snow and more http://goo.gl/nDnTM

Cover Photograph by Ph.D. candidate Si Chen. Dartmouth Engineer Magazine http://goo.gl/FsqqR1

Others: The Electron Microscopy Unit of the Beltsville Agricultural Research Center in Beltsville http://goo.gl/xteHY

#ScienceEveryday   #HolidayScience  

Posted in Rajini Rao | Tagged , | 59 Comments

Dendritic Forests and Purkinje Cell Trees

Dendritic Forests and Purkinje Cell Trees

This image has an empty alt attribute; its file name is slide2.jpg

The Little Brain: Tucked under and in the back of our two major brain hemispheres is the cerebellum (Latin for “little brain”). Best known for coordinating fine motor skills, the cerebellum receives signals from the spinal cord and other parts of the brain to refine and compute an output that lets us reach out and precisely touch an object with the tip of our finger. All of this output is made by a single type of cell: the Purkinje neuron. Not surprisingly, they have been described as, “the only source of news, the sole TV network, the cerebellar state-controlled media”.

A Primer on Purkinje Neurons: These are among the largest and earliest neuron types to be described (by Czech anatomist Jan Evangelista Purkyně in 1837). Arranged in a domino-like layer (image 1-2) in the cerebellum, each neuron has a distinctive tree-like shape (image 3), with elaborate branches called dendrites which make contact with other neuron types. Each Purkinje cell makes >200,000 contacts with other cells, receiving  enormously noisy informational input which is then selectively suppressed and sculpted by a complex algorithm that is not fully understood. 

Sentinel Circuit: New research shows that Purkinje neurons release factors that trigger development of  two very different cell types (excitatory and inhibitory) in the cerebellum. Curiously, these cells then regulate the activity of the Purkinje cells themselves. Why? This may be an elaborate means of self regulation. It is thought that an imbalance in these two opposing functions can underlie psychiatric and neurodevelopmental disorders including schizophrenia and autism spectrum disorders. 

A great pop-sci read titled Purkinje Worldhttp://goo.gl/nJiS1J

Ref: The Purkinje Neuron Acts as a Central Regulator of Spatially and Functionally Distinct Cerebellar Precursors (2013). Fleming et al., http://goo.gl/lmf0Kq. See news story here: http://goo.gl/gJILgo

Another installment in the occasional series on #excyting  cell types for #ScienceSunday .

Posted in Rajini Rao | Tagged , | 19 Comments

Pedigree Puzzle: Why is there a Gender Bias in Autism?

Pedigree Puzzle: Why is there a Gender Bias in Autism?

Autism Spectrum Disorders are more frequently diagnosed in males than females: commonly four times as often, although that bias climbs to 11:1 in the case of Asperger’s syndrome. The underlying reasons are complex and many plausible theories have been proposed. Let’s begin by looking at one example of pronounced gender bias in autism, seen in this pedigree chart. A pedigree chart is used by geneticists to track genotypes (such as a particular mutation) and phenotypes (such as appearance of a disease) over many generations of an extended family.  If you’ve never deciphered one before, this is your chance to figure out what those squares and circles mean! 

How to Read a Pedigree Chart: To begin, girls are circles and boys are squares – helpfully colorized to pink or blue to fit the stereotype 😉 There are four generations in this chart (I-IV), each in a separate row. Offspring from a pair are shown by the T bars: for example, the first pair (now deceased) had four children, two males and two females. One of the females produced the four children shown in generation III. Progeny from three pairs are shown in generation IV. Makes sense so far?

Linking Genes to Autism: Back to the Science. Researchers monitored the SHANK1 gene in ~2,600 people with autism and ~15,000 “controls”. They found a large deletion that wiped out most of one copy of the gene in four people with autism. Three were in the family shown in the pedigree chart. None in the control group had this deletion, so this was a statistically significant difference. In gene speak, we say there is a Copy Number Variation (CNV) in this gene. The Shank proteins act as scaffolds around which the synapse, or junction between nerve cells, is built. Other SHANK genes have already been linked to autism, so they used pedigree analysis on SHANK1. Six members of the family carried the CNV but surprisingly, only males with CNV were diagnosed with autism (labeled A in the chart). In case you are wondering, SHANK1 is not on the X chromosome, so the gene is not sex linked. So why are only males in this family autists even though they carry the same mutation as some of the females? This is an extreme case of gender bias in autism. Although the precise answer is not known for the SHANK1 mutation, we will follow some testable hypotheses in future posts! 

★ Reference (free read): Shank1 deletions in males with autism spectrum disorder. Sato et al., 2012

http://www.ncbi.nlm.nih.gov/pmc/articles/PMC3376495/

___________________________________________________

Links to my older posts on autism are here:

The Genetics of Autismhttp://goo.gl/AzTuAX

Autism Spectrum Disorders from Mechanism to Therapyhttp://goo.gl/y751QH

A Part of the Puzzle: NHE9 and Autismhttp://goo.gl/YXbOkN

#ScienceSunday . 


Posted in Rajini Rao | Tagged | 77 Comments

Petrichor: Smell of the Earth

Petrichor: Smell of the Earth

A heavenly scent: Do you love the smell of soil after a fresh bout of rain? Are you a fan of the earthy smell of beets? There is a word for that: petrichor.  It comes from the Greek petros, meaning stone and ichor, the fluid that flows in the veins of the gods. It is defined as “the distinctive scent which accompanies the first rain after a long warm dry spell”. 

Geosmin: After puzzling over the smell of soil for over a hundred years, scientists have pinned the source to Streptomyces, the soil bacterium that also gifts us with the most antibiotics. The bacteria release volatile compounds when disturbed, like the bicyclic alcohol, geosmin (named for “earthy smell”). Did you know that the human nose is incredibly sensitive to geosmin? We can detect as little as ten parts per trillion! 

One hump or two?: Bactrian camels are reputed to detect water from 50 miles away. The signature smell of Streptomyces is easily carried across the desert and picked up by the camel’s sensitive nose. In return, the bacterium probably benefits from having its spores spread around. The musty earth scent of some Cactus flowers is also due to a derivative of geosmin. It lures pollinating insects by a promise of water. This is known as floral mimicry. Unfortunately, fish that absorb minute amounts of geosmin from water don’t taste that great.

✿ This smelly chemistry post is a birthday present for our favorite Google+ chemist Siromi Samarasinghe! Check out other odoriferous posts in Sirome’s honor by Chad Haney (http://goo.gl/INUpXi , http://goo.gl/SN4WQs and http://goo.gl/XpVL9R). 

Image: Streptomyces coelicolor http://microbewiki.kenyon.edu/index.php/Streptomyces

Source and Ref: http://www.bios.niu.edu/meganathan/smell_of_soil.shtml

#ScienceEveryday  

Posted in Rajini Rao | Tagged | 96 Comments

Turkey and Tryptophan: Thanksgiving Myth Debunked

Turkey and Tryptophan: Thanksgiving Myth Debunked

ƵƵƶƶ Why do we feel sleepy after a big meal? You’ve probably blamed the Thanksgiving turkey for having too much tryptophan, an amino acid that the body converts to serotonin and melatonin, two sleep-inducing compounds. But it turns out that tryptophan has to be consumed on an empty stomach and not with gourmandish excess of cranberry sauce and pumpkin pie, to be effectively blamed for your soporific state.  Did you know that even oat bran and soybeans contain more tryptophan than turkey? Check out this infographic ▶ http://goo.gl/pQtLTp .

ƵƵƶƶ Another popular theory is that after a big meal, our body diverts blood supply to the gut, and away from the brain, to help digestion. While this seems logical, it turns out that cerebral blood flow and oxygenation are kept stable through autoregulation mechanisms even when blood flow to the gut or muscles increase after a meal or during exercise.  Blood vessels in the brain expand or contract in response to changes in blood pressure to keep flow constant. Another myth debunked! 

ƵƵƶƶ The most likely culprits are gut-brain hormones that regulate both feeding and sleep. Orexin is one such example: it promotes hunger and alertness, but is inhibited by gastric distention and satiety. The ability of hunger to promote alertness is thought to be an evolutionary adaptation that keeps us motivated to search for food. Interestingly, mutations in orexin were recently linked to narcolepsy, a pathological form of sleepiness. Finally, it has been argued that sleep allows for “cognitive reinforcement” of the circumstances that led to your energy acquisition, an important survival skill! So when postprandial somnolence hits you after your big Thanksgiving meal, you’re actually learning an age-old survival mechanism 🙂 

Ref: http://www.ncbi.nlm.nih.gov/pubmed/15488646

Gif: Via http://www.reactiongifs.com/tag/sleepy/

#ScienceEveryday   #HappyThanksgiving  

Posted in Rajini Rao | Tagged , | 120 Comments

Good Fat is BAT!

Good Fat is BAT!

Beige, Brite, Brown or White: If you thought all fat was white and wobbly, think again. Some fat depots are colored brown because they are rich in mitochondria– powerhouses of energy loaded with iron-containing cytochrome proteins (bottom panel in image). Beige/Brite fat cells are in between white and brown fat. Human infants have stores of this brown adipose tissue (BAT), up to 5% of their body weight, between their shoulder blades and in their neck, colored green in the MRI scan (top image). Hibernating animals stock up on brown fat too. Why? Because brown fat generates heat.

The Heat is On: Our mitochondria are factories that extract energy from food and store it in the form of a proton (Hydrogen ion) gradient across their borders. Like water cascading down a fall turns a turbine to generate electricity, this gradient of protons can run downhill through the ATP synthase, propelling it like a motor to capture energy from food by making a chemical compound called ATP. But if these protons ran downhill without doing any work, their potential energy would be lost as heat. The mitochondria in brown fat do just that. They make an uncoupling protein that short circuits the proton gradient to generate heat instead of ATP. This form of thermogenesis is important to newborns and hibernating animals who can’t use the shiver reflex to give off heat from their muscles.  

Better with BAT: Since brown fat burns calories, more BAT could counter obesity, cardiovascular disease and Type 2 diabetes. But adult humans lose most brown fat during adolescence. Fortunately, new studies show that we do have some, mostly deep inside our neck (lower image). One approach to increasing BAT is exposure to cold! Brrr … if that sounds uncomfortable, stem cells may boost your BAT. Curiously, brown fat cells share a common lineage, not with white fat cells, but with muscle cells. Recent research has revealed the presence of adult stem cells that can be coaxed into active BAT. The hope is to induce these cells to form calorie-burning brown fat in humans. Now that’s a healthier browning than a tan!   

◑ Images and Refs: (1) Evidence for two types of brown adipose tissue in humans. 

 http://www.nature.com/nm/journal/v19/n5/full/nm.3017.html

(2) How brown is brown fat? Depends where you look. Nedergaard and Cannon Nature Medicine 19, 540–541 (2013)

#ScienceSunday

Posted in Rajini Rao | Tagged | 77 Comments